2.8 Reading a pressure–enthalpy (P-h) diagram
Enthalpy (h) is the heat content of one kilogram of refrigerant, in kJ/kg. On a P-h diagram, enthalpy runs along the bottom (x-axis). Pressure runs up the side (y-axis), usually on a log scale.
A dome-shaped curve sits in the middle. Left of the dome is liquid. Inside it is a liquid–vapour mix. Right of it is vapour. The left edge is the saturated liquid line; the right edge is the saturated vapour line.
The cycle draws as a rough box:
- 4 → 1, evaporation: horizontal line at low pressure, moving right. The length is heat absorbed.
- 1 → 2, compression: a line going up and to the right. The horizontal shift is compressor work.
- 2 → 3, condensation: horizontal line at high pressure, moving left. The length is heat delivered.
- 3 → 4, expansion: a vertical line straight down. Enthalpy does not change.
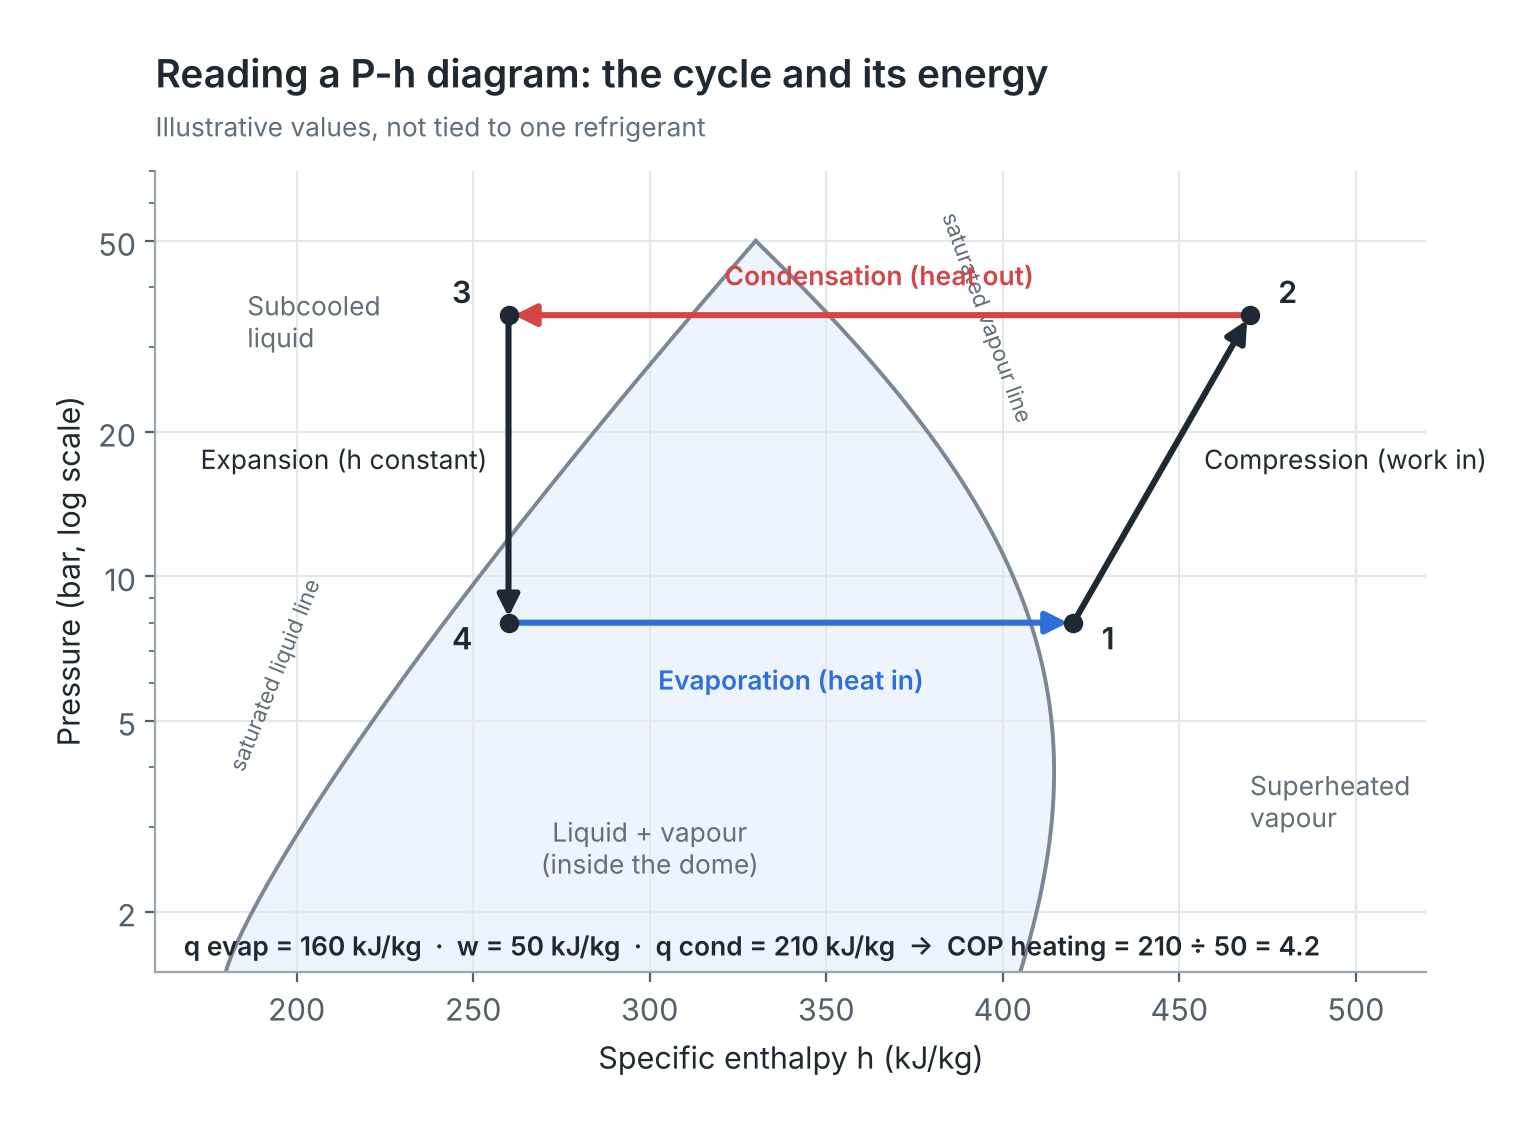
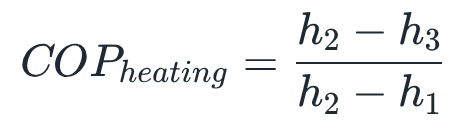
Worked example — COP from a P-h diagram (illustrative enthalpies).
- Read from the diagram: h1 = 420 kJ/kg, h2 = 470 kJ/kg, h3 = h4 = 260 kJ/kg.
- Heat delivered qcond = 470 − 260 = 210 kJ/kg.
- Compressor work w = 470 − 420 = 50 kJ/kg.
- COP = 210 ÷ 50 = 4.2.
- Check: qevap = 420 − 260 = 160 kJ/kg, and 160 + 50 = 210. The balance holds.
Mass flow for a 12 kW unit: m = 12 ÷ 210 ≈ 0.057 kg/s.
Remember
- Horizontal = pressure constant; vertical = enthalpy constant.
- Evaporation and condensation are horizontal lines.
- Expansion is vertical: no energy added or removed.
- COP = condenser enthalpy change ÷ compressor enthalpy change.
The P-h diagram is a map of the refrigerant; the cycle drawn on it shows every state and lets you read heat and work directly as horizontal distances.
There are no comments for now.
to be the first to leave a comment.