8.7 Reading a factory performance test report
Before dispatch, good factories run each unit, or a sample, on a test bench. The bench controls the air and water conditions and records performance. The record is called a performance test report.
On site, this report is your baseline. If site readings differ a lot from the report at similar conditions, something has changed — installation, water flow, charge or supply voltage.
Sample performance test record (generic)
Refrigerant: R410A. Unit type: air-to-water heat pump, rated 20 kW heating at 20 °C ambient, 40 → 45 °C water. Tolerance: ±5% on capacity and COP (typical; the real figure is set in the test specification).
| Test no. | Ambient DB (°C) | Ambient RH (%) | Water in (°C) | Water out (°C) | Flow (m³/h) | Capacity (kW) | Voltage (V) | Current (A) | Input power (kW) | COP | Suction P (bar g) | Discharge P (bar g) | SH (K) | SC (K) | Result |
|---|---|---|---|---|---|---|---|---|---|---|---|---|---|---|---|
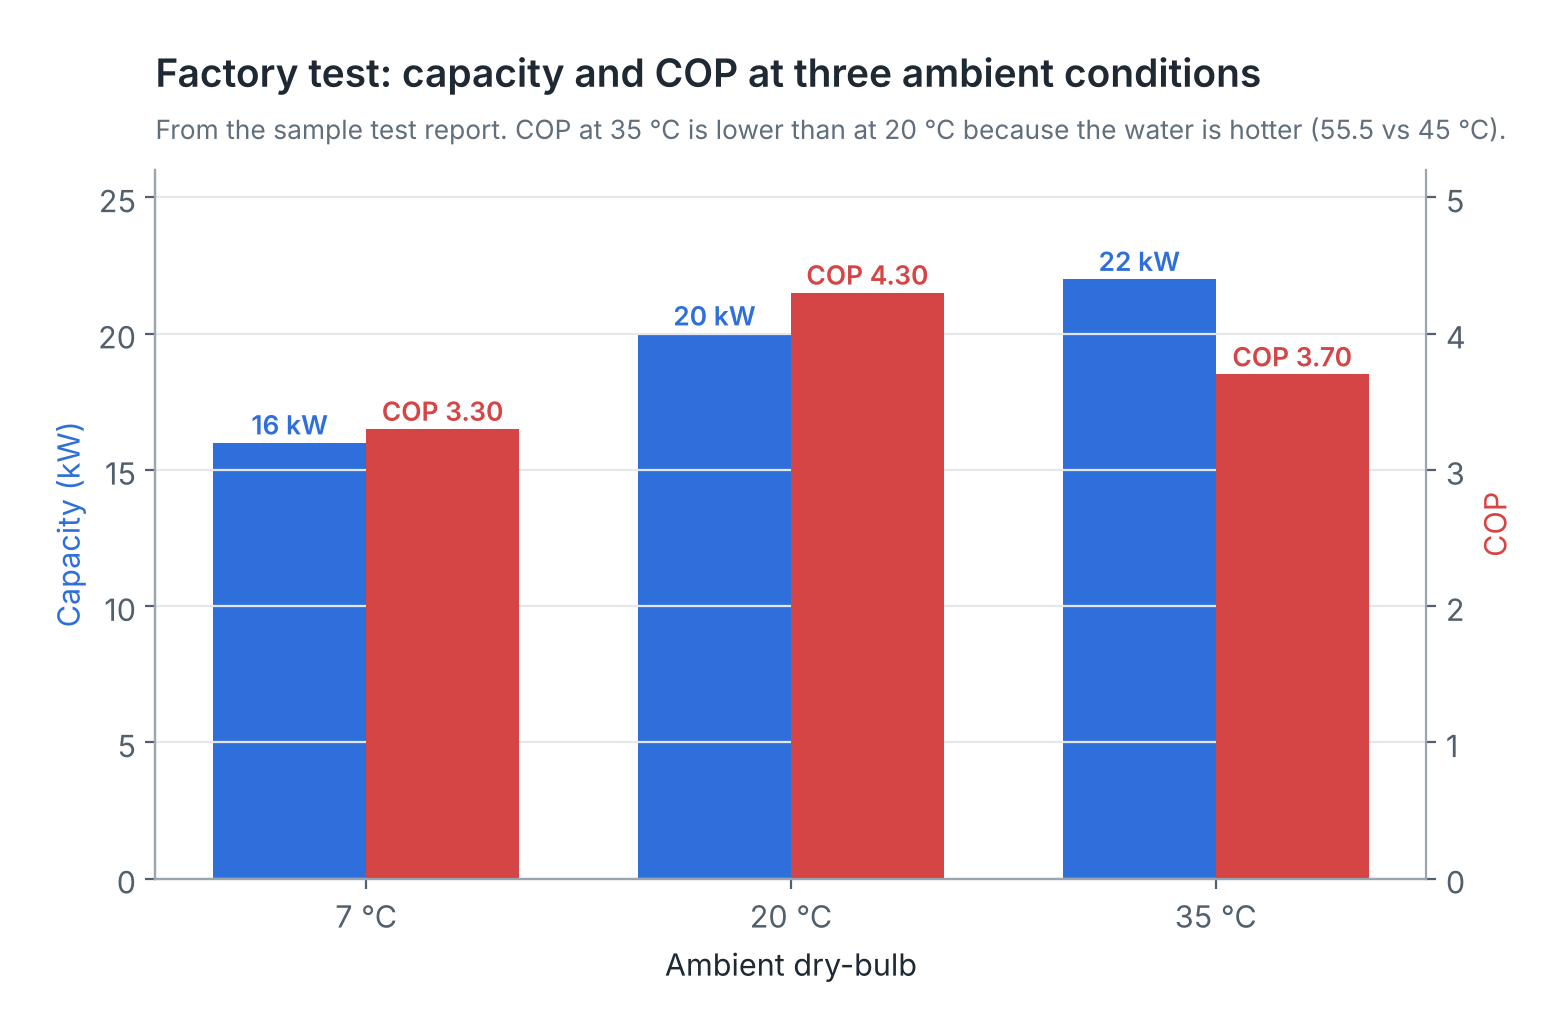
| T1 | 20 | 65 | 40.0 | 45.0 | 3.44 | 20.0 | 415 | 7.4 | 4.65 | 4.30 | 9.8 | 29.5 | 6 | 5 | Pass |
| T2 | 7 | 85 | 41.0 | 45.0 | 3.44 | 16.0 | 415 | 7.7 | 4.85 | 3.30 | 6.0 | 29.5 | 5 | 4 | Pass |
| T3 | 35 | 45 | 50.0 | 55.5 | 3.44 | 22.0 | 412 | 9.5 | 5.95 | 3.70 | 12.5 | 37.0 | 7 | 5 | Pass |
How the numbers fit: Capacity = Flow (LPH) × ΔT / 860. For T1: 3440 × 5.0 / 860 = 20.0 kW. COP = 20.0 / 4.65 = 4.30.
| Column | What it means | What to look for |
|---|---|---|
| Test no. | Test point identifier | Each rating condition has its own row |
| Ambient DB | Dry-bulb air temperature at coil inlet | Defines the test condition |
| Ambient RH | Relative humidity of inlet air | High RH at low ambient means frost and defrost |
| Water in / out | Water temperatures at unit inlet and outlet | ΔT should match the design (here about 4–5.5 K) |
| Flow | Water flow rate through the condenser | Site flow should be close to this |
| Capacity | Heat delivered, from flow × cp × ΔT | Compare with rated value ± tolerance |
| Voltage | Supply voltage during test | Results apply at this voltage |
| Current | Running current per phase | Site current should be similar at similar conditions |
| Input power | Measured electrical input in kW | Includes compressor, fan and controls (check if pump is included) |
| COP | Capacity ÷ input power | Falls with lower ambient and higher water temperature |
| Suction P / Discharge P | Refrigerant pressures (gauge) | Baseline for site gauge readings |
| SH / SC | Superheat and subcooling | Baseline for charge checks |
| Result | Pass or fail against tolerance | Any fail must be explained and retested |
Other items on a good report: unit serial number, refrigerant type and charge, test date, bench instrument calibration reference, tester name and signature, and electrical safety tests (insulation resistance, earth continuity, high-voltage test).
Remember
- A test result only means something together with its test conditions.
- Check that capacity = flow × ΔT / 860 on the report; the numbers must agree.
- Confirm whether input power includes the water pump.
- Keep a copy of the report in the site file as the performance baseline.
A factory test report proves each unit met its design performance under controlled conditions; learn to read every column.
There are no comments for now.
to be the first to leave a comment.